
Extensions
KrewDashboard
MESCIUS
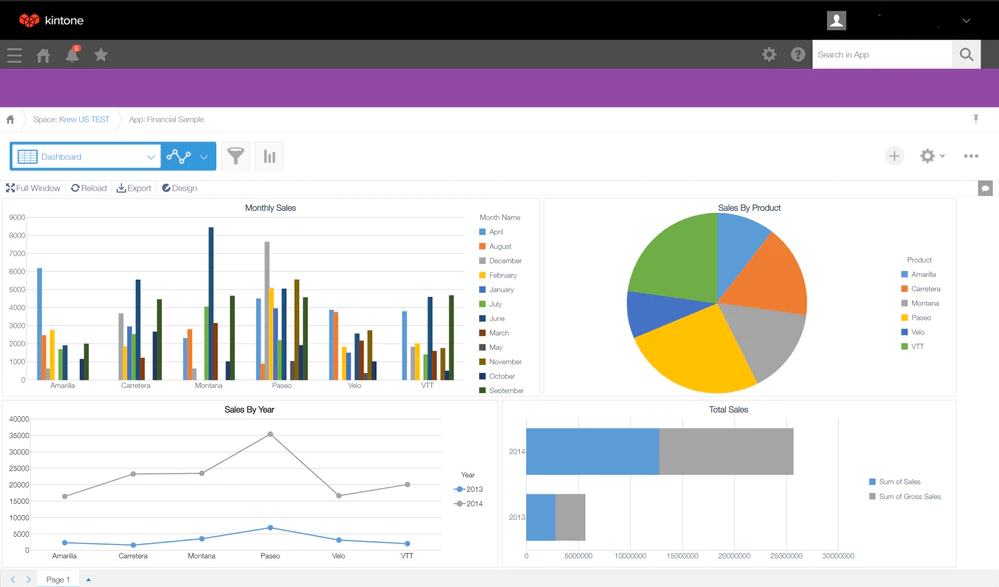
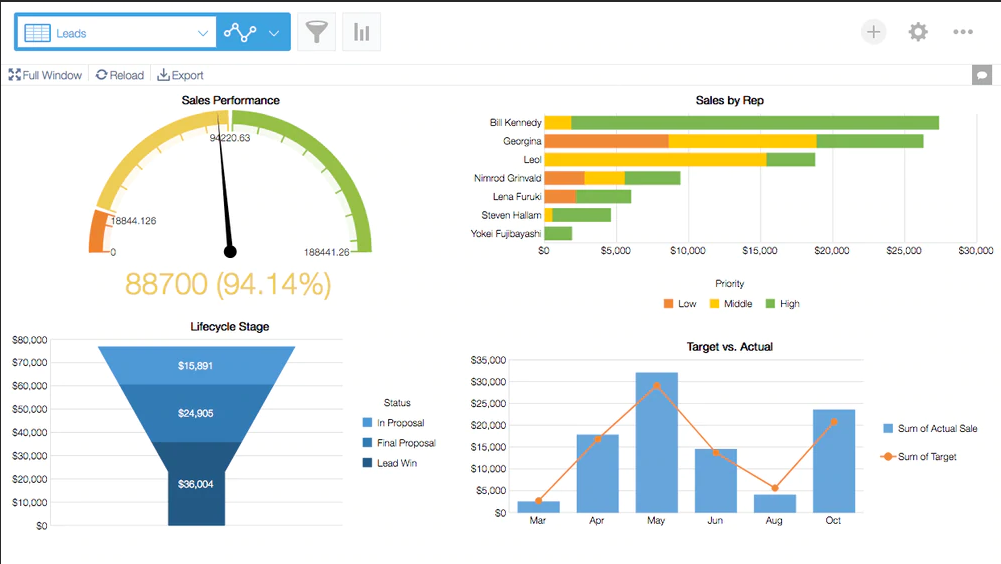
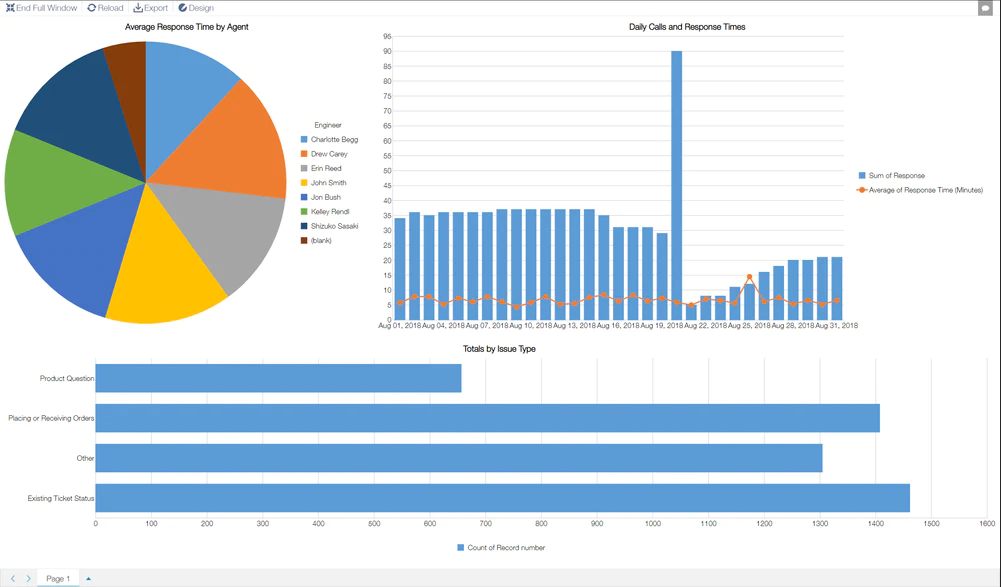
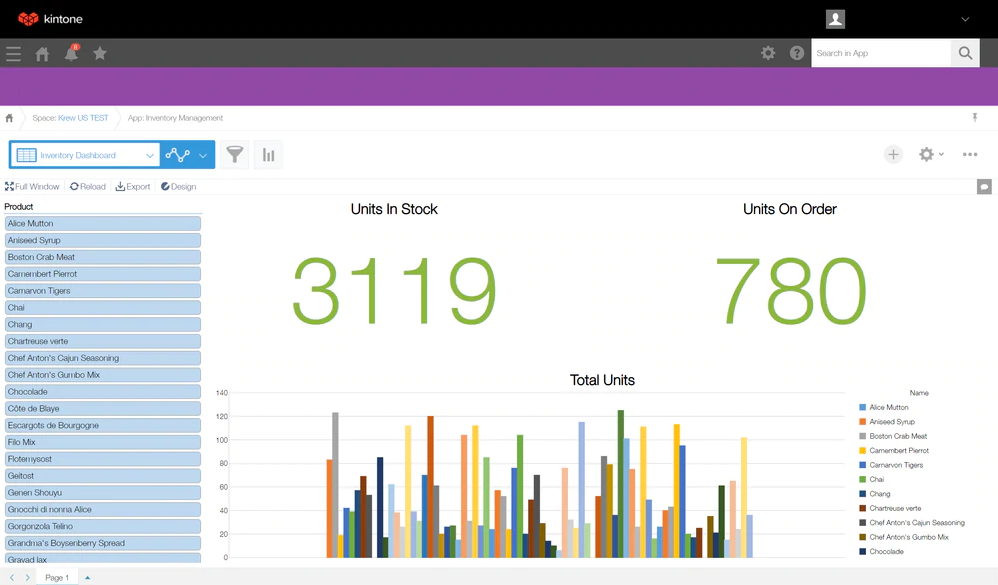
KrewDashboard visualizes data from multiple apps in one place through informative charts and pivot tables
Are you in need of a dashboard that allows you to get data across multiple Kintone apps? Try out krewDashboard.
Kintone has great out-of-the-box chart functionalities, but JavaScript customization is needed to visualize data from multiple apps. krewDashboard allows you to visualize data from any number of apps without any coding, supporting a swift status check and insight to make quick smart decisions.
Ready to get started ?