


JOYZO
BUDGET TRACKER
$37.50/Month
Billed annually
CATEGORY
Data Entry
Output / Document Management
LATEST RELEASE
Ver.1
DESCRIPTION
The Budget Tracker Plug-in allows you to effortlessly create visual comparisons between data stored in two different apps, and updates the comparisons automatically. You will just need an app with target data such as a budget, sales goals, etc. and an app to record actual data in. By linking the two, you will get a set of three charts to compare the two data sets with, allowing you to visualize the status of your actual results to your goals.
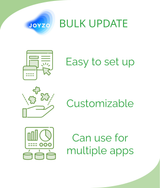
FEATURES
- Set of three comparison charts: a bar chart, a stacked bar chart, and a table
- Quickly and easily see where actual results stand compared to budgets or goals
- Choose any combination of the three to be displayed at a time with check boxes that toggle the charts on and off
- Visualize data even further with an optional second level of data grouping
USE CASES
- See how close a team is to making their targets in terms of dollar amounts or other units
- See how much of a budget has been used or is left
COST
- Budget Tracker $37.5/subdomain/mo. (annual contract)
By clicking “FREE TRIAL” or “ADD TO CART” below, you agree to the Terms of Use of each Plug-in developer.